
Automating a Production-Ready K8s Cluster with Ansible
A guide to deploying a production-ready K8s cluster on Debian/Ubuntu using Ansible, featuring Rook-Ceph, Envoy Gateway, FluxCD, and a full observability stack.
This post walks through a set of Ansible playbooks that fully automate a production-ready Kubernetes cluster on Debian or Ubuntu nodes. The setup goes from base OS configuration through Rook-Ceph for storage, Envoy Gateway for ingress, FluxCD for GitOps, and a complete observability stack with Prometheus and Grafana.
Component Versions#
All component versions are pinned for reproducible deployments and can be customized in the Ansible inventory.
| Component | Version |
|---|---|
| Kubernetes | 1.34.9 |
| Container runtime | containerd |
| Pod networking | Calico 3.32.0 (eBPF dataplane) |
| Load balancer | MetalLB 0.16.1 |
| TLS management | cert-manager v1.13.0 |
| Distributed storage | Rook-Ceph 1.19.7 |
| GitOps | FluxCD 2.18.4 |
| Ingress | Envoy Gateway 1.8.1 |
| Monitoring | kube-prometheus-stack 87.2.1 |
| Kubernetes Dashboard | 7.14.0 |
| Helm CLI | 3.21.2 |
Architecture Overview#
The cluster is designed for robustness and modern cloud-native practices.
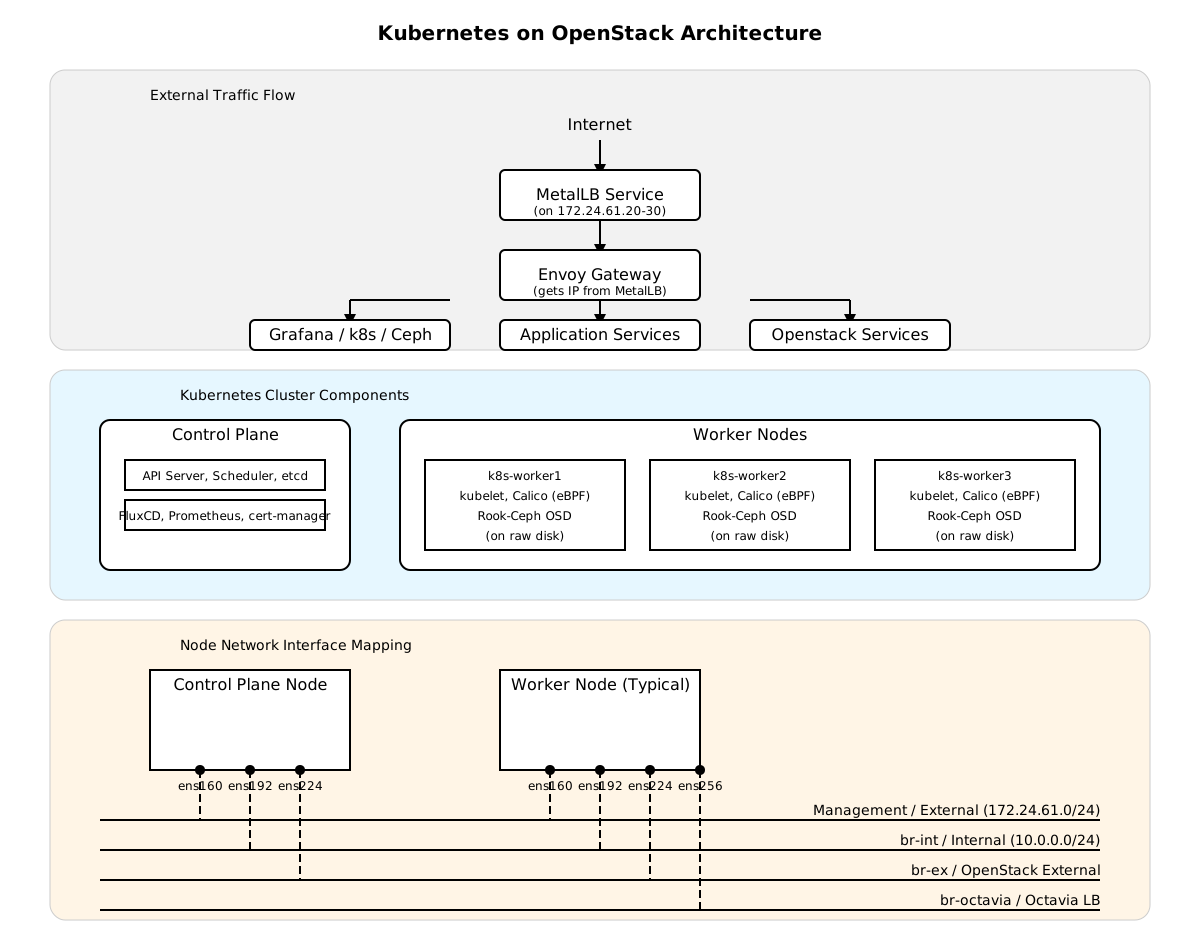
External traffic     |
MetalLB (L2/BGP)  -->  Envoy Gateway  -->  HTTPRoutes
                     |              +---------------+---------------+
                     v              v               v
                 Grafana        k8s-dash        Ceph-dash
                     ^              |
                     |  cert-manager (self-signed wildcard)
                     |
  kube-prometheus-stack
    Prometheus --> scrapes via ServiceMonitor
    Grafana    --> sidecar watches ConfigMaps (dashboards)
                       ^
    Rook-Ceph ServiceMonitor (labeled release: kube-prometheus-stack)

  Rook-Ceph (operator + cluster + StorageClass: general)

FluxCD (GitOps controller)Network Configuration#
The nodes in this setup utilize multiple network interfaces, a common pattern in virtualized environments like OpenStack. Here’s a typical netplan configuration for the control plane:
network:
  version: 2
  ethernets:
    ens160:
      addresses:
        - '172.24.61.40/24'
      nameservers:
        addresses:
          - 8.8.8.8
      routes:
        - to: 'default'
          via: '172.24.61.254'
    ens192:
      addresses:
        - '10.0.0.4/24'
    ens224:
dhcp4: falseens160: The primary interface for external access and Ansible management (172.24.61.0/24).ens192: An internal network for cluster communication (10.0.0.0/24).ens224: An external flat network used by OpenStack.ens256: An internal network used by Octavia LB communication.
The worker nodes follow a similar pattern, with an additional interface (ens256) often reserved for octavia lb communication traffic.
network:
  version: 2
  ethernets:
    ens160:
      addresses:
        - '172.24.61.41/24'
      nameservers:
        addresses:
          - 8.8.8.8
      routes:
        - to: 'default'
          via: '172.24.61.254'
    ens192:
      addresses:
        - '10.0.0.1/24'
    ens224:
      dhcp4: false
    ens256:
dhcp4: falseAnsible Roles#
The automation is broken down into logical Ansible roles:
common: Configures the base OS, disables swap, installscontainerd, sets up required kernel modules, and installskubelet,kubeadm, andkubectl.control_planes: Initializes the Kubernetes control plane usingkubeadmand installs the Calico CNI.nodes: Joins the worker nodes to the cluster.cluster_addons: Deploys the entire application stack, including MetalLB, cert-manager, Rook-Ceph, FluxCD, Envoy Gateway, and the monitoring components.update-and-reboot: A maintenance playbook for system-wide updates and reboots.
Prerequisites#
System Requirements#
| Control plane | Worker nodes | |
|---|---|---|
| OS | Debian 11/12 or Ubuntu 22.04/24.04 | same |
| CPU | 2+ cores | 2+ cores |
| RAM | 4 GB+ | 2 GB+ |
| Disk | 30 GB+ | 20 GB+ (+ raw disks for Ceph) |
| Network | Static IP, internet access | same |
Note: Ceph requires at least one raw (unformatted) block device per worker node. The Calico eBPF dataplane requires a Linux kernel version of 5.3 or higher.
Control Machine Setup#
# Install Ansible and the kubernetes.core collection
sudo apt update && sudo apt install -y ansible python3-pip
ansible-galaxy collection install kubernetes.core

# Install python3-kubernetes
sudo apt install -y python3-pip python3-kubernetes
pip3 install kubernetes --break-system-packages

# Verify
ansible --versionYou will also need to configure passwordless SSH access from your control machine to all cluster nodes.
# Generate a key pair if needed
ssh-keygen -t ed25519 -C "ansible"

# Copy to every node (adjust IPs to match your inventory)
ssh-copy-id root@172.24.61.40   # control plane
ssh-copy-id root@172.24.61.41   # worker 1
ssh-copy-id root@172.24.61.42   # worker 2
ssh-copy-id root@172.24.61.43 # worker 3Installation#
Step 1: Configure Inventory#
Clone the project repository and edit the inventory/dev file to match your node IPs.
[control_planes]
k8s-control-plane1 ansible_host=172.24.61.40

[nodes]
k8s-worker1 ansible_host=172.24.61.41
k8s-worker2 ansible_host=172.24.61.42
k8s-worker3 ansible_host=172.24.61.43Step 2: Review Configuration#
Key variables are located in inventory/group_vars/all.yaml. Pay special attention to the networking and monitoring sections.
# Networking
metallb_mode: 'l2'
metallb_ip_range: '172.24.61.20-172.24.61.30'
metallb_l2_interface: 'ens160'
gateway_ip: '172.24.61.20'

# Calico eBPF
calico_ebpf: true
calico_ebpf_dsr: true

# Monitoring
grafana_admin_password: 'ChangeMe123!'Step 3: Deploy#
You can deploy the entire cluster with a single command:
ansible-playbook -i inventory/dev playbooks/k8s_all.yamlFor the first run, it’s recommended to execute the playbooks one by one:
# 1. Base OS configuration on all nodes
ansible-playbook -i inventory/dev playbooks/common.yaml

# 2. Initialise control plane and install Calico
ansible-playbook -i inventory/dev playbooks/control_planes.yaml

# 3. Join worker nodes
ansible-playbook -i inventory/dev playbooks/nodes.yaml

# 4. Install the full add-on stack
ansible-playbook -i inventory/dev playbooks/cluster_addons.yamlStep 4: Access the Cluster#
Copy the kubeconfig from the control plane to your local machine to manage the cluster with kubectl.
scp root@172.24.61.40:~/.kube/config ~/.kube/config
kubectl get nodesDeep Dive: Calico eBPF Networking#
This setup uses Calico’s eBPF dataplane, which replaces kube-proxy entirely. This offers several advantages over the standard iptables-based mode, including lower latency, higher throughput, and better scalability.
| Standard Calico (iptables) | Calico eBPF | |
|---|---|---|
| Service routing | kube-proxy iptables rules | eBPF programs in kernel |
kube-proxy dependency | Required | Eliminated |
| External traffic path | SNAT on ingress node | Direct Server Return (no extra hop) |
| Connection scaling | O(n) iptables rules | O(1) eBPF map lookups |
The control_planes role automates the configuration by patching the FelixConfiguration and disabling the kube-proxy DaemonSet.
Deep Dive: Monitoring Stack#
The cluster_addons playbook deploys a kube-prometheus-stack and integrates it with Rook-Ceph for comprehensive monitoring.
Ceph Dashboard Integration#
A key challenge is getting the Ceph dashboards into Grafana reliably. The solution used here is both robust and idempotent:
- The Ansible playbook uses
curlon the control plane to fetch the official dashboard JSON files directly from the Rook-Ceph GitHub repository, version-locked to the deployed Ceph version. - It then creates a
ConfigMapin themonitoringnamespace for each dashboard. - These
ConfigMaps are labeled withgrafana_dashboard: "1". - A Grafana sidecar container (
k8s-sidecar) is configured to watch forConfigMaps with this label across all namespaces and automatically hot-loads them into Grafana.
This approach ensures dashboards survive Grafana restarts and are automatically updated when the Ceph version is changed in the Ansible variables.
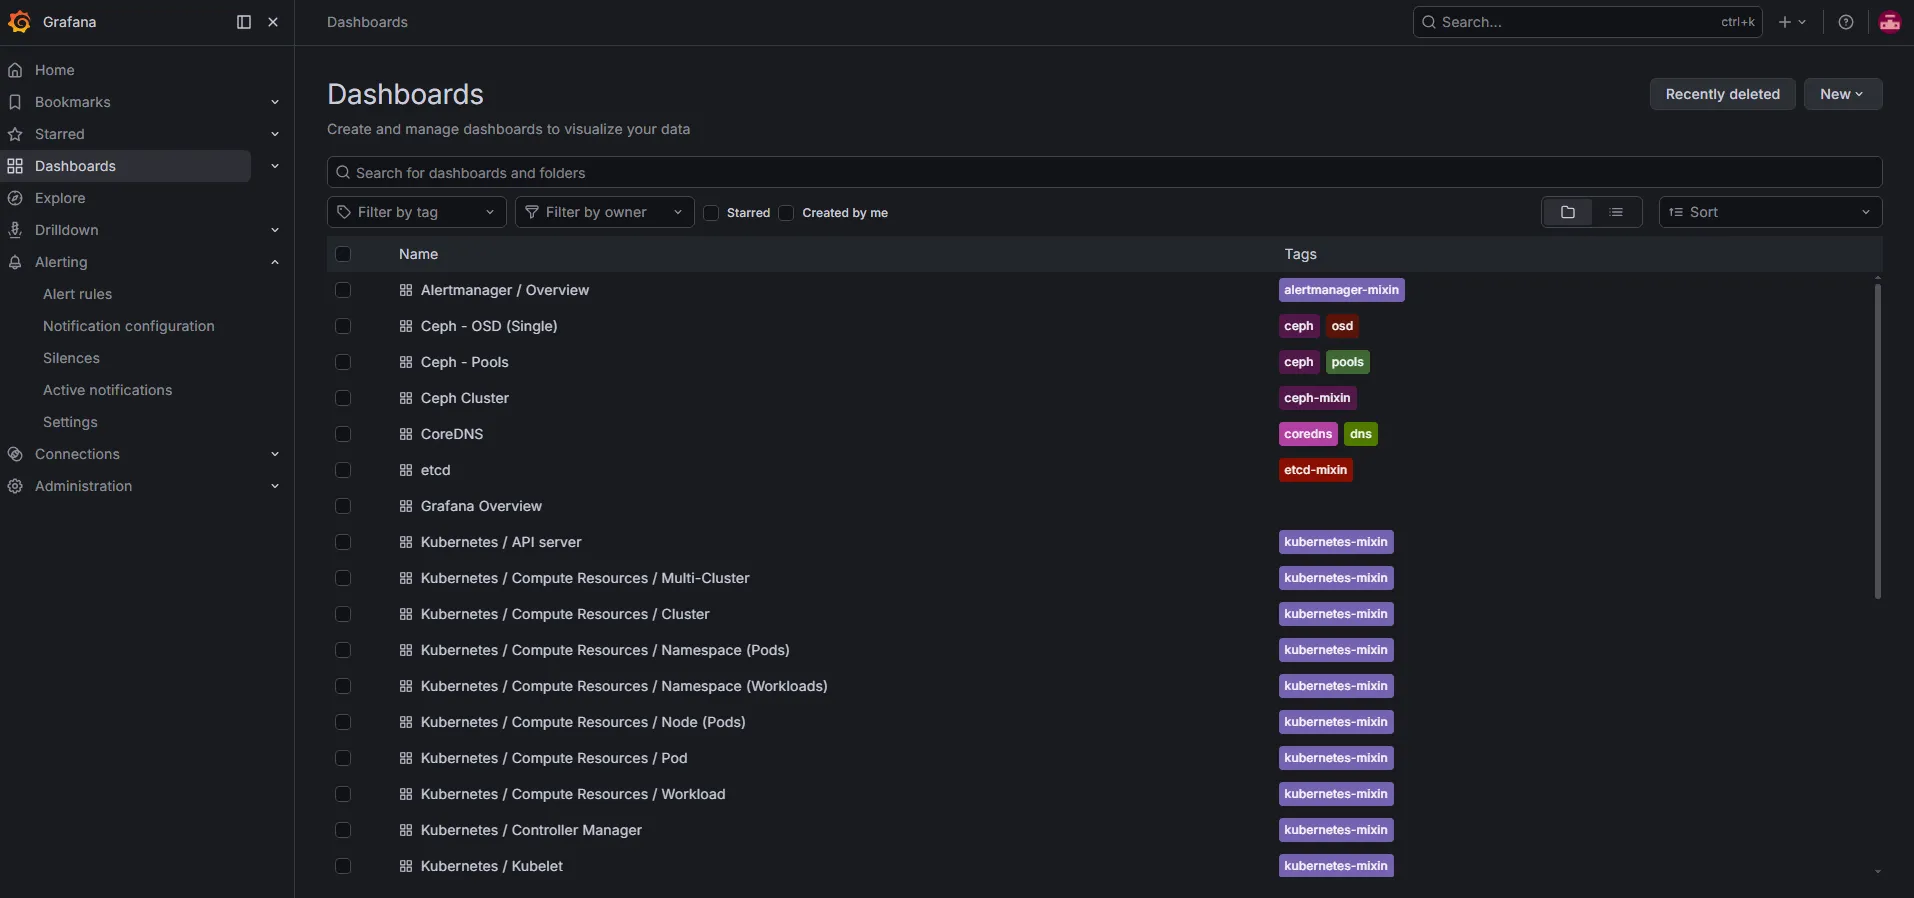
Here is the list of dashboards automatically loaded into Grafana:
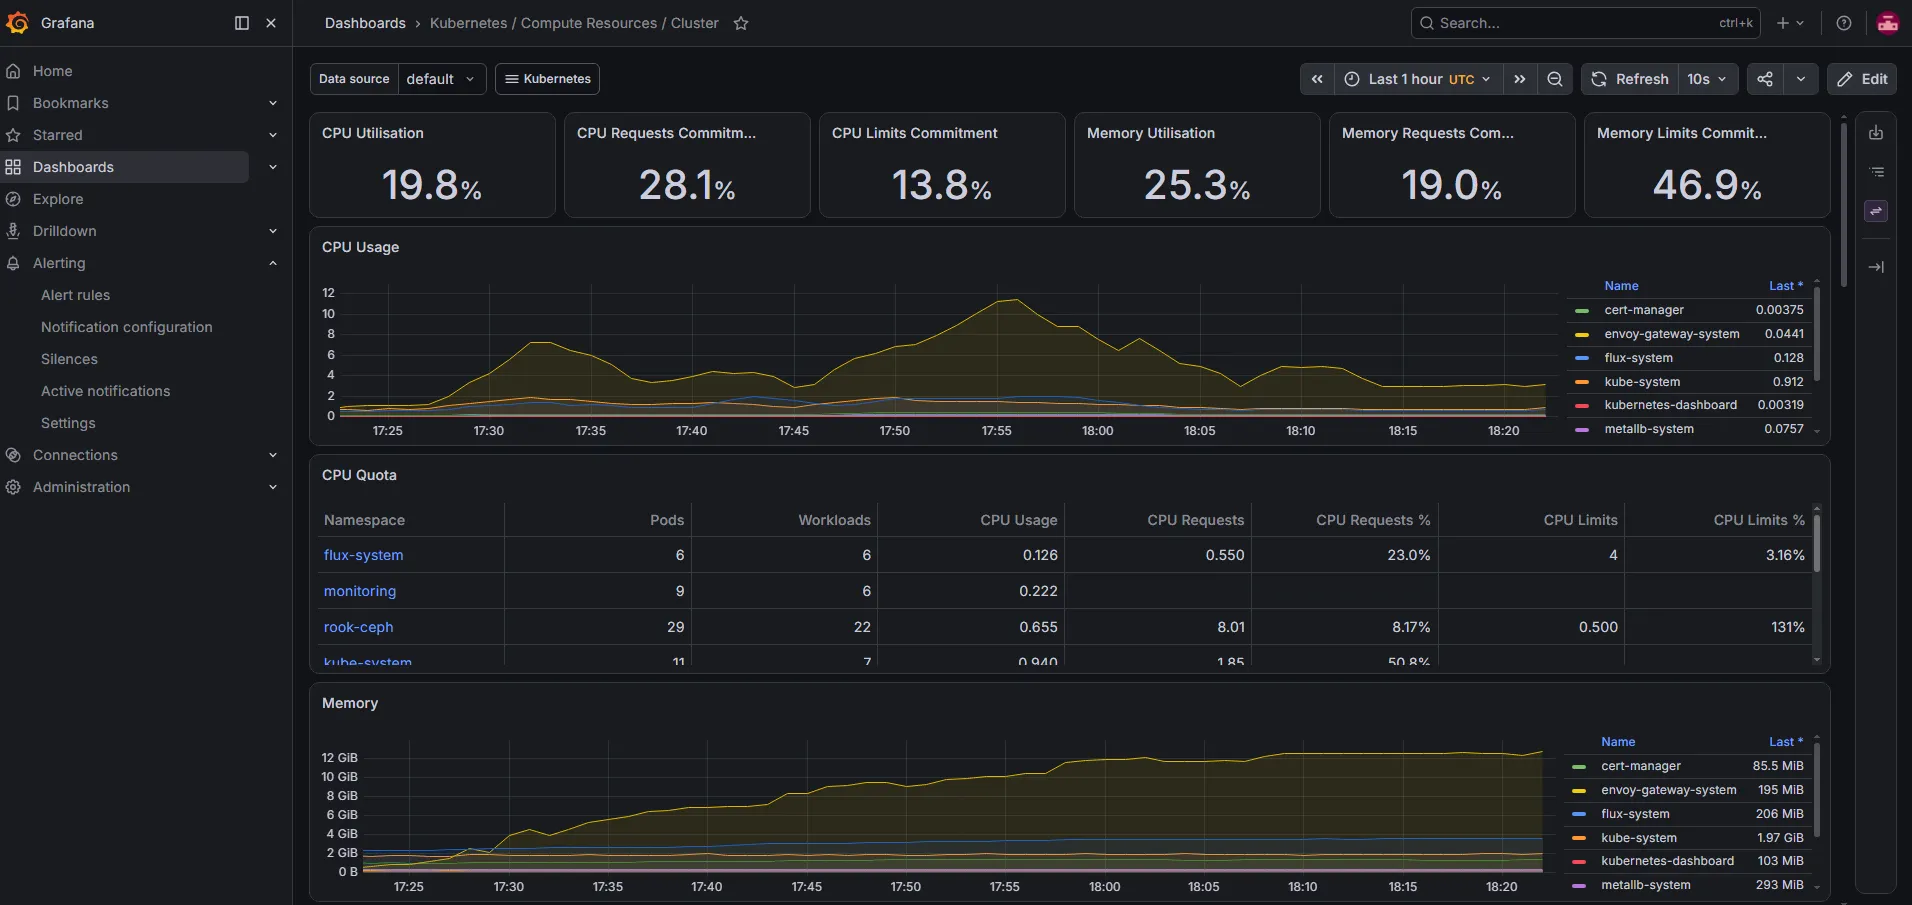
And here is an example of the main cluster dashboard:
Accessing Dashboards#
At the end of a successful deployment, the playbook prints an access summary. The services are exposed via MetalLB and Envoy Gateway using nip.io for DNS.
| Service | URL | Credentials |
|---|---|---|
| Grafana | https://grafana.<gw-ip>.nip.io | admin / grafana_admin_password |
| Kubernetes Dashboard | https://dashboard.<gw-ip>.nip.io | Bearer token (printed at run end) |
| Rook-Ceph Dashboard | https://ceph.<gw-ip>.nip.io | admin / auto-generated (printed at run end) |
All services are secured with self-signed HTTPS certificates managed by cert-manager.
Maintenance and Troubleshooting#
The playbooks are idempotent, so they can be re-run safely.
# Rolling OS update + reboot
ansible-playbook -i inventory/dev playbooks/update-and-reboot.yaml

# Re-run only the add-on stack
ansible-playbook -i inventory/dev playbooks/cluster_addons.yaml

# Check Ceph cluster health
kubectl exec -n rook-ceph deploy/rook-ceph-tools -- ceph statusThis project provides a powerful and repeatable foundation for running Kubernetes in a production environment. The combination of Ansible’s automation with best-in-class cloud-native tools creates a cluster that is both feature-rich and maintainable.